Python matplotlib : grid (그래프 격자선 설정)
matplotlib에서 grid를 이용하면 그래프에 격자선을 넣을 수 있습니다.
import matplotlib.pyplot as plt
list_x = [1, 2, 3, 4, 5]
list_y = [90, 46, 70, 10, 89]
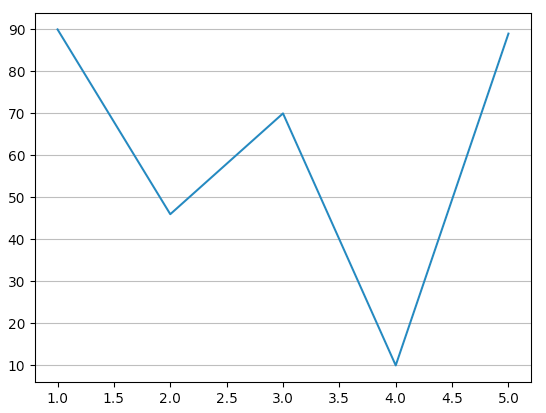
plt.plot(list_x, list_y)
plt.show()

위 코드처럼 그냥 pyplot을 이용해 그래프를 그리면 그래프만 나타나고 그래프 배경에 격자선이 없습니다.
import matplotlib.pyplot as plt
list_x = [1, 2, 3, 4, 5]
list_y = [90, 46, 70, 10, 89]
plt.plot(list_x, list_y)
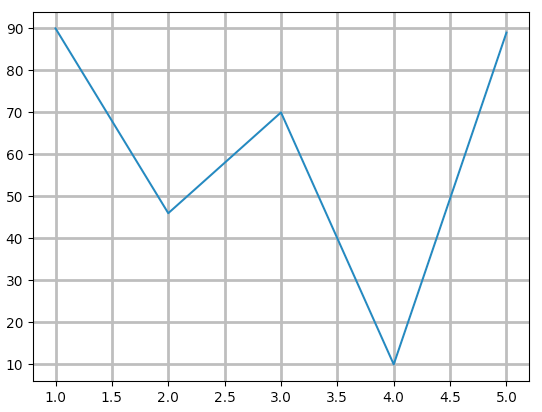
plt.grid(visible=True)
plt.show()

위처럼 grid method의 visible option을 True로 설정하면 그래프 배경에 격자선을 추가할 수 있습니다.
이제 grid method에서 사용할 수 있는 주요한 option들을 알아보겠습니다.
종류는 다음과 같습니다.
- both = both / x / y
grid가 어느 축에 대해 적용될지를 의미합니다.
- color
grid의 색상을 설정합니다.
- linewidth
grid의 두께를 설정합니다.
- linestyle = '-' / '--' / '-.' / ':' / ''
grid line의 스타일을 설정합니다.
각 옵션별로 어떻게 적용할 수 있는지 아래 예시를 통해 봅시다.
1. axis
import matplotlib.pyplot as plt

list_x = [1, 2, 3, 4, 5]
list_y = [90, 46, 70, 10, 89]

plt.plot(list_x, list_y)
plt.grid(visible=True, axis='y')

plt.show()
axis='y'
grid가 y축에 대해 그려졌습니다.
따라서 y축의 값에 따라 가로줄이 그려졌습니다.
import matplotlib.pyplot as plt

list_x = [1, 2, 3, 4, 5]
list_y = [90, 46, 70, 10, 89]

plt.plot(list_x, list_y)
plt.grid(visible=True, axis='x')

plt.show()
axis='x'
grid가 x축에 대해 그려졌습니다.
따라서 x축의 값에 따라 세로줄이 그려졌습니다.
2. color
import matplotlib.pyplot as plt

list_x = [1, 2, 3, 4, 5]
list_y = [90, 46, 70, 10, 89]

plt.plot(list_x, list_y)
plt.grid(visible=True, color='pink')

plt.show()
- color='pink'
grid가 분홍색으로 설정되었습니다.
3. linewidth
import matplotlib.pyplot as plt

list_x = [1, 2, 3, 4, 5]
list_y = [90, 46, 70, 10, 89]

plt.plot(list_x, list_y)
plt.grid(visible=True, linewidth=2)

plt.show()
- linewidth=2
grid의 두께가 2로 설정되었습니다.
4. linestyle
import matplotlib.pyplot as plt

list_x = [1, 2, 3, 4, 5]
list_y = [90, 46, 70, 10, 89]

plt.plot(list_x, list_y)
plt.grid(visible=True, linestyle='--')

plt.show()

- linestyle='--'
grid line 스타일이 점선으로 변경되었습니다.
- linestyle = '-' / '--' / '-.' / ':' / ''
적용할 수 있는 linestyle은 위와 같습니다.