| 일 | 월 | 화 | 수 | 목 | 금 | 토 |
|---|---|---|---|---|---|---|
| 1 | 2 | 3 | ||||
| 4 | 5 | 6 | 7 | 8 | 9 | 10 |
| 11 | 12 | 13 | 14 | 15 | 16 | 17 |
| 18 | 19 | 20 | 21 | 22 | 23 | 24 |
| 25 | 26 | 27 | 28 | 29 | 30 | 31 |
- numpy
- dataframe
- c#
- Github
- GIT
- PANDAS
- Tkinter
- Java
- Apache
- SQL
- Google Spreadsheet
- PySpark
- string
- Kotlin
- Python
- Google Excel
- Presto
- array
- gas
- google apps script
- 파이썬
- math
- django
- matplotlib
- Redshift
- list
- hive
- PostgreSQL
- Excel
- Today
- Total
달나라 노트
Python Pandas : Tabulate, DataFrame을 가독성 좋게 print하기 (tabulate library 이용. pretty print dataframe) 본문
Python Pandas : Tabulate, DataFrame을 가독성 좋게 print하기 (tabulate library 이용. pretty print dataframe)
CosmosProject 2021. 10. 23. 14:59
tabulate을 이용하여 DataFrame을 terminal에서 더 가독성 좋게(이쁘게) 출력하는 방법을 알아봅시다.
import pandas as pd

dict_test = {
    'col1': [1, 2, 3, 4, 5],
    'col2': ['Apple', 'Banana', 'Watermelon', 'Grape', 'Melon'],
    'col3': ['a', 'b', 'c', 'd', 'e'],
}

df_test = pd.DataFrame(dict_test)
print(df_test)
위 코드를 실행해보면 그 결과로 아래 이미지와 같은 내용이 출력됩니다.

정상적으로 DataFrame이 출력되긴 했죠.
그러나 가독성이 그닥 좋아보이진 않습니다.
지금 예시로 사용된 DataFrame은 굉장히 간단해서 이것만으로도 충분할 수 있으나,
column과, row도 더 많아지고 그 속의 데이터도 복잡해진다면 단순히 DataFrame을 print하는 것 만으로는 가독성이 너무 좋지 않을 수 있습니다.
pip install tabulatetabulate을 이용할 것이므로 tabulate을 설치해줍시다.
import pandas as pd
from tabulate import tabulate

dict_test = {
    'col1': [1, 2, 3, 4, 5],
    'col2': ['Apple', 'Banana', 'Watermelon', 'Grape', 'Melon'],
    'col3': ['a', 'b', 'c', 'd', 'e'],
}

df_test = pd.DataFrame(dict_test)
print(tabulate(df_test, headers='keys', tablefmt='psql', showindex=True))
그리고 위처럼 코드를 tabulate을 사용하도록 바꿔봅시다.
(tabulate의 자세한 사용법은 바로 다음에 설명하겠습니다.)
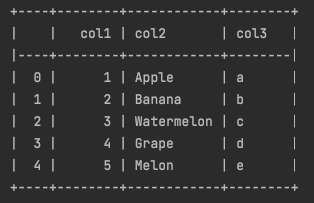
위 코드를 실행한 결과입니다.
DataFrame의 여러 부분에 테두리가 생기면서 훨씬 가독성이 좋아졌죠.
이렇게 tabulate을 이용하면 가독성 좋은 DataFrame(pretty table)을 terminal에 출력할 수 있습니다.
import pandas as pd
from tabulate import tabulate

dict_test = {
    'col1': [1, 2, 3, 4, 5],
    'col2': ['Apple', 'Banana', 'Watermelon', 'Grape', 'Melon'],
    'col3': ['a', 'b', 'c', 'd', 'e'],
}

df_test = pd.DataFrame(dict_test)
print(tabulate(df_test, headers='keys', tablefmt='psql', showindex=True))
이 코드에서 tabulate의 사용법을 보면
가장 먼저 tabulate을 적용할 DataFrame을 적어줍니다.(df_test)
headers='keys'
이것은 각 컬럼의 이름(header)을 명시할지에 대한 여부입니다.
이것을 생략하면 컬럼이름이 보여지지 않습니다.
(dataframe의 key(column name)를 column name(header)로 사용하라는 의미)
tablefmt='psql'
tabulate으로 DataFrame을 꾸밀 때 어떤 형태로 꾸밀지를 결정하는 부분입니다.
위 예시는 psql format으로 dataframe을 print한 것입니다.
showindex=True
이 부분은 dataframe의 row index를 표시할지를 결정하는 부분입니다.
True -> row index 표시
False -> row index 표시 안함
import pandas as pd
from tabulate import tabulate

dict_test = {
    'col1': [1, 2, 3, 4, 5],
    'col2': ['Apple', 'Banana', 'Watermelon', 'Grape', 'Melon'],
    'col3': ['a', 'b', 'c', 'd', 'e'],
}

df_test = pd.DataFrame(dict_test)
print(tabulate(df_test, headers='keys', tablefmt='psql', showindex=True))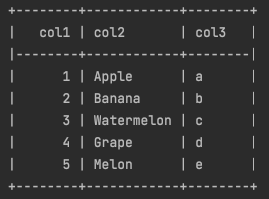
showindex=False로 설정했더니 index가 표시되지 않는 걸 볼 수 있습니다.
import pandas as pd
from tabulate import tabulate

dict_test = {
    'col1': [1, 2, 3, 4, 5],
    'col2': ['Apple', 'Banana', 'Watermelon', 'Grape', 'Melon'],
    'col3': ['a', 'b', 'c', 'd', 'e'],
}

df_test = pd.DataFrame(dict_test)
print(tabulate(df_test, headers='keys', tablefmt='psql', showindex=True, numalign='left'))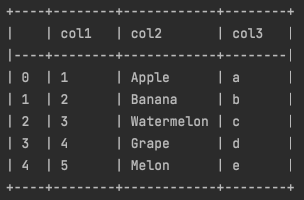
numalign='left'
위 예시에선 numalign이라는 인자를 추가했는데 이것은 숫자 데이터를 어디로 정렬할지를 나타냅니다.
left라고 하였으므로 숫자가 왼쪽 정렬된 것을 볼 수 있습니다.
numalign='left' -> 숫자 왼쪽 정렬
numalign='right' -> 숫자 오른쪽 정렬
numalign='center' -> 숫자 가운데 정렬
import pandas as pd
from tabulate import tabulate

dict_test = {
    'col1': [1, 2, 3, 4, 5],
    'col2': ['Apple', 'Banana', 'Watermelon', 'Grape', 'Melon'],
    'col3': ['a', 'b', 'c', 'd', 'e'],
}

df_test = pd.DataFrame(dict_test)
print(tabulate(df_test, headers='keys', tablefmt='psql', showindex=True, stralign='center'))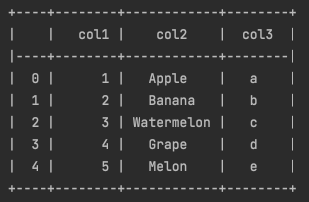
stralign='center'
위 예시에선 stralign이라는 인자를 추가했는데 이것은 텍스트 데이터를 어디로 정렬할지를 나타냅니다.
center라고 하였으므로 숫자가 가운데 정렬된 것을 볼 수 있습니다.
stralign='left' -> 텍스트 왼쪽 정렬
stralign='right' -> 텍스트 오른쪽 정렬
stralign='center' -> 텍스트 가운데 정렬
이제 tabulate의 tablefmt에 사용할 수 있는 여러 형식을 봅시다.
tablefmt='fancy_grid'
import pandas as pd
from tabulate import tabulate

dict_test = {
    'col1': [1, 2, 3, 4, 5],
    'col2': ['Apple', 'Banana', 'Watermelon', 'Grape', 'Melon'],
    'col3': ['a', 'b', 'c', 'd', 'e'],
}

df_test = pd.DataFrame(dict_test)
print(tabulate(df_test, headers='keys', tablefmt='fancy_grid', showindex=True))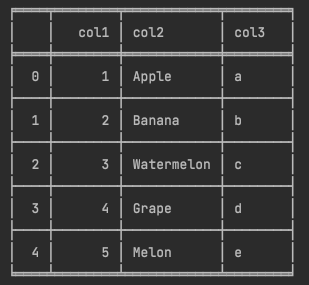
tablefmt='html'
import pandas as pd
from tabulate import tabulate

dict_test = {
    'col1': [1, 2, 3, 4, 5],
    'col2': ['Apple', 'Banana', 'Watermelon', 'Grape', 'Melon'],
    'col3': ['a', 'b', 'c', 'd', 'e'],
}

df_test = pd.DataFrame(dict_test)
print(tabulate(df_test, headers='keys', tablefmt='html', showindex=True))
이렇게 dataframe을 html에서 사용하는 table tag로 구성해줄 수도 있습니다.
굉장히 편리하죠.
tablefmt='pretty'
import pandas as pd
from tabulate import tabulate

dict_test = {
    'col1': [1, 2, 3, 4, 5],
    'col2': ['Apple', 'Banana', 'Watermelon', 'Grape', 'Melon'],
    'col3': ['a', 'b', 'c', 'd', 'e'],
}

df_test = pd.DataFrame(dict_test)
print(tabulate(df_test, headers='keys', tablefmt='pretty', showindex=True))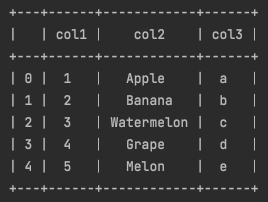
tablefmt='plain'
import pandas as pd
from tabulate import tabulate

dict_test = {
    'col1': [1, 2, 3, 4, 5],
    'col2': ['Apple', 'Banana', 'Watermelon', 'Grape', 'Melon'],
    'col3': ['a', 'b', 'c', 'd', 'e'],
}

df_test = pd.DataFrame(dict_test)
print(tabulate(df_test, headers='keys', tablefmt='plain', showindex=True))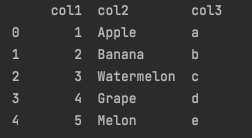
tablefmt='rst'
import pandas as pd
from tabulate import tabulate

dict_test = {
    'col1': [1, 2, 3, 4, 5],
    'col2': ['Apple', 'Banana', 'Watermelon', 'Grape', 'Melon'],
    'col3': ['a', 'b', 'c', 'd', 'e'],
}

df_test = pd.DataFrame(dict_test)
print(tabulate(df_test, headers='keys', tablefmt='rst', showindex=True))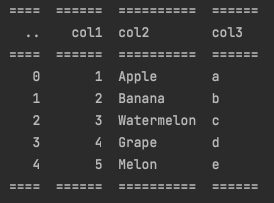
tablefmt='github'
import pandas as pd
from tabulate import tabulate

dict_test = {
    'col1': [1, 2, 3, 4, 5],
    'col2': ['Apple', 'Banana', 'Watermelon', 'Grape', 'Melon'],
    'col3': ['a', 'b', 'c', 'd', 'e'],
}

df_test = pd.DataFrame(dict_test)
print(tabulate(df_test, headers='keys', tablefmt='github', showindex=True))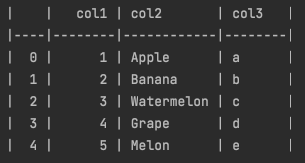
tablefmt='tsv'
import pandas as pd
from tabulate import tabulate

dict_test = {
    'col1': [1, 2, 3, 4, 5],
    'col2': ['Apple', 'Banana', 'Watermelon', 'Grape', 'Melon'],
    'col3': ['a', 'b', 'c', 'd', 'e'],
}

df_test = pd.DataFrame(dict_test)
print(tabulate(df_test, headers='keys', tablefmt='tsv', showindex=True))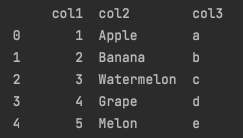
tablefmt='.4f'
import pandas as pd
from tabulate import tabulate

dict_test = {
    'col1': [1, 2, 3, 4, 5],
    'col2': ['Apple', 'Banana', 'Watermelon', 'Grape', 'Melon'],
    'col3': ['a', 'b', 'c', 'd', 'e'],
}

df_test = pd.DataFrame(dict_test)
print(tabulate(df_test, headers='keys', tablefmt='tsv', showindex=True))
import pandas as pd
from tabulate import tabulate

dict_test = {
    'col1': [1, 2, 3, 4, 5],
    'col2': ['사과', '바나나바나나바나나바나나', '수박수박수박수박', '포도', '멜론'],
    'col3': ['Apple', 'Banana', 'Watermelon', 'Grape', 'Melon'],
    'col4': ['a', 'b', 'c', 'd', 'e'],
}

df_test = pd.DataFrame(dict_test)
print(tabulate(df_test, headers='keys', tablefmt='psql', showindex=False))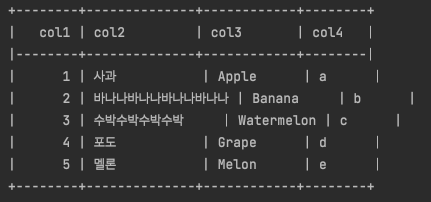
tabulate 등의 pretty table 전환을 할 때에는 한글 사용에 주의해야합니다.
위처럼 dataframe의 한글이 있다면 column의 간격이 틀어질 수 있습니다.
그 이유는 한글 1글자는 숫자 또는 영어 1글자와 너비가 다르기때문이죠.
그래서 위처럼 공백은 동일하게 삽입되었으나 실제 한글은 더 너비가 넓어서 column의 간격이 제대로 보여지지 않는 경우가 발생할 수 있습니다.
'Python > Python Pandas' 카테고리의 다른 글
| Python Pandas : xlrd.biffh.XLRDError: Excel xlsx file; not supported (read_excel Error) (0) | 2022.02.11 |
|---|---|
| Python Pandas : to_list (Series를 list type으로 만들기) (0) | 2021.10.27 |
| Python Pandas : shift (행 위치 옮기기) (0) | 2021.09.28 |
| Python Pandas : to_json (Series 또는 DataFrame을 json 형태로 변환하기) (0) | 2021.09.14 |
| Python Pandas : duplicated (중복값 확인하기) (0) | 2021.08.31 |
