| 일 | 월 | 화 | 수 | 목 | 금 | 토 |
|---|---|---|---|---|---|---|
| 1 | 2 | 3 | 4 | 5 | 6 | 7 |
| 8 | 9 | 10 | 11 | 12 | 13 | 14 |
| 15 | 16 | 17 | 18 | 19 | 20 | 21 |
| 22 | 23 | 24 | 25 | 26 | 27 | 28 |
- Java
- Tkinter
- numpy
- Excel
- c#
- Google Spreadsheet
- SQL
- GIT
- math
- list
- string
- Google Excel
- Redshift
- hive
- PostgreSQL
- 파이썬
- Presto
- matplotlib
- PySpark
- django
- gas
- google apps script
- Github
- dataframe
- array
- Kotlin
- Python
- Apache
- PANDAS
- Today
- Total
달나라 노트
Python matplotlib : legend (범례 표시, 범례 표시하기, 항목 표시하기) 본문
Python matplotlib : legend (범례 표시, 범례 표시하기, 항목 표시하기)
CosmosProject 2022. 1. 17. 23:42
matplotlib의 legend method를 이용하면 chart에 범례를 표시할 수 있습니다.
import matplotlib.pyplot as plt

labels = ['Cake', 'Chocolate', 'Candy', 'Macaroon', 'Waffle']
values = [20, 35, 10, 50, 20]

plt.pie(values, labels=labels, colors=['skyblue', 'pink', 'grey', 'lightgreen', 'yellow'])
plt.legend()

plt.show()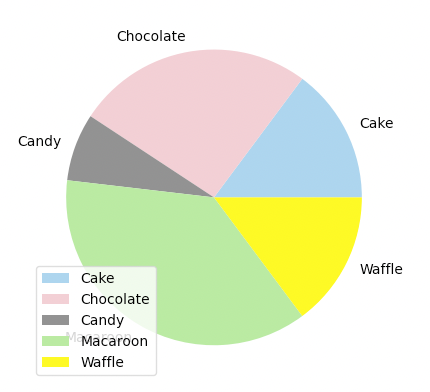
위 코드에서처럼 legend method를 적어준 것 만으로도 범례가 표시되죠.
범례의 위치는 자동으로 적당한 위치에 나타나도록 결정됩니다.
import matplotlib.pyplot as plt

labels = ['Cake', 'Chocolate', 'Candy', 'Macaroon', 'Waffle']
values = [20, 35, 10, 50, 20]

plt.pie(values, labels=labels, colors=['skyblue', 'pink', 'grey', 'lightgreen', 'yellow'])
plt.legend(loc=(0.5, 0.5))

plt.show()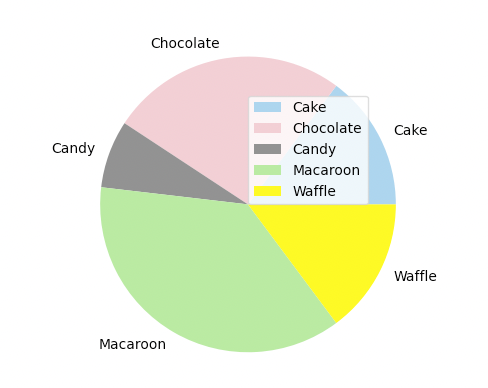
legend method에 loc 옵션은 범례 박스의 위치를 조절할 수 있도록 해줍니다.
(0.5, 0.5)의 의미는 범례의 위치를 의미하며, 결과로 나오는 차트의 x축 50%지점 y축 50% 지점에 범례 박스를 나타내라는 의미입니다.
더 정확히 말하면 범례의 왼쪽 하단 꼭지점이 x축 50%지점 y축 50% 지점에 오도록 범례 박스를 나타내라는 의미입니다.
import matplotlib.pyplot as plt

labels = ['Cake', 'Chocolate', 'Candy', 'Macaroon', 'Waffle']
values = [20, 35, 10, 50, 20]

plt.pie(values, labels=labels, colors=['skyblue', 'pink', 'grey', 'lightgreen', 'yellow'])
plt.legend(loc='upper left')

plt.show()
단순 좌표 뿐 아니라 lower right, lower left, upper right, upper left 과 같은 대략적인 위치를 전달할 수도 있습니다.
아래 표는 loc 옵션에 범례의 위치를 설정할 때 간편하게 사용할 수 있는 범례 위치 코드입니다.
Location String이나 Location Code 둘 중 아무거나 사용해도 되며 각각의 의미는 Description을 보면 됩니다.
| Location String | Location Code | Description |
| 'best' | 0 | 그래프에서 가장 적절한 위치에 범례 표시 (default) |
| 'upper right' | 1 | 우측 상단에 범례 표시 |
| 'upper left' | 2 | 좌측 상단에 범례 표시 |
| 'lower left' | 3 | 좌측 하단에 범례 표시 |
| 'lower right' | 4 | 우측 하단에 범례 표시 |
| 'right' | 5 | 우측에 범례 표시 |
| 'center left' | 6 | 좌측 가운데에 범례 표시 |
| 'center right' | 7 | 우측 가운데에 범례 표시 |
| 'lower center' | 8 | 가운데 하단에 범례 표시 |
| 'upper center' | 9 | 가운데 상단에 범례 표시 |
| 'center' | 10 | 가운데에 범례 표시 |
출처 = https://matplotlib.org/stable/api/_as_gen/matplotlib.pyplot.legend.html
import matplotlib.pyplot as plt

labels = ['Cake', 'Chocolate', 'Candy', 'Macaroon', 'Waffle']
values = [20, 35, 10, 50, 20]

plt.pie(values, labels=labels, colors=['skyblue', 'pink', 'grey', 'lightgreen', 'yellow'])
plt.legend(ncol=3)

plt.show()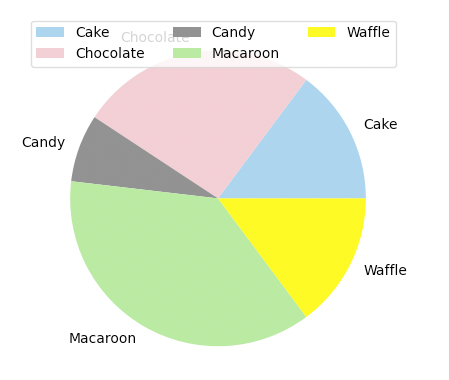
ncol 옵션은 범례를 나타낼 때 몇개의 열(column)이 있도록 나타낼지를 정합니다.
기본은 1개의 열에 여러 행을 나타내서 범례들을 표시하지만
위 예시에서처럼 ncol 옵션을 3으로 설정하면 3개의 열(column)되도록 범례를 표시합니다.
import matplotlib.pyplot as plt

labels = ['Cake', 'Chocolate', 'Candy', 'Macaroon', 'Waffle']
values = [20, 35, 10, 50, 20]

plt.pie(values, labels=labels, colors=['skyblue', 'pink', 'grey', 'lightgreen', 'yellow'])
plt.legend(frameon=True)

plt.show()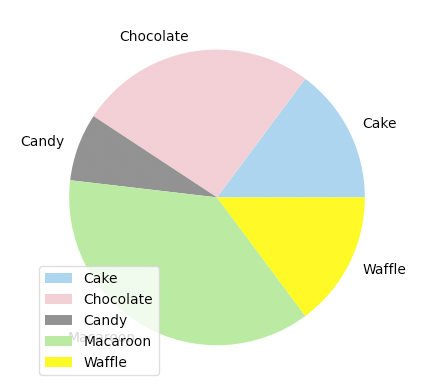
frameon 옵션을 True로 설정하면 범례 박스의 테두리가 나타납니다.
import matplotlib.pyplot as plt

labels = ['Cake', 'Chocolate', 'Candy', 'Macaroon', 'Waffle']
values = [20, 35, 10, 50, 20]

plt.pie(values, labels=labels, colors=['skyblue', 'pink', 'grey', 'lightgreen', 'yellow'])
plt.legend(fontsize=5)

plt.show()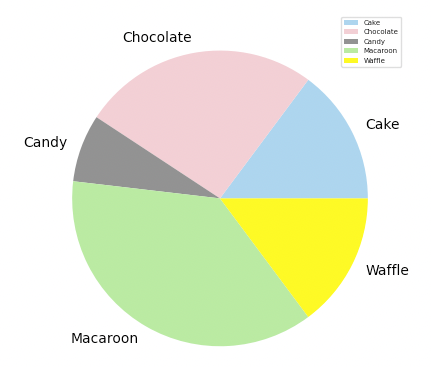
fontsize 옵션을 이용하면 범례에 나타나는 글자의 크기 조절도 가능합니다.
import matplotlib.pyplot as plt

labels = ['Cake', 'Chocolate', 'Candy', 'Macaroon', 'Waffle']
values = [20, 35, 10, 50, 20]

plt.pie(values, labels=labels, colors=['skyblue', 'pink', 'grey', 'lightgreen', 'yellow'])
plt.legend(shadow=True)

plt.show()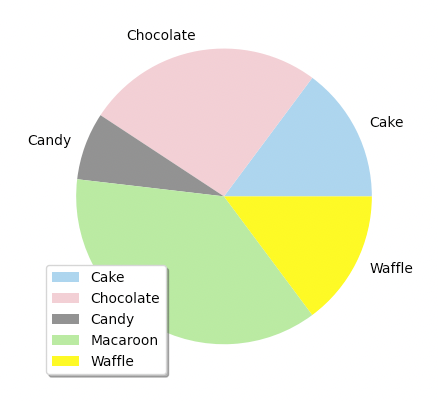
shadow 옵션을 True로 하면 범례박스에 그림자가 표시되도록 할 수 있습니다.
import matplotlib.pyplot as plt

list_x = [1, 2, 3, 4, 5]
list_y = [2, 3, 4, 5, 6]

plt.plot(list_x, list_y, label='First line')
plt.legend()

plt.show()
legend method를 이용한 범례 표시는 다른 그래프에도 가능합니다.
위 예시는 선 그래프에 범례 표시를 한 예시입니다.
단, line chart는 pie chart처럼 그래프를 그릴 때 범례를 기본적으로 지정하지 않기 때문에 line chart의 label을 명시해줘야 합니다.
plot method에서 그래프를 그릴 때 label 옵션을 이용해서 원하는 line chart의 범례 이름이 뭔지 정해줄 수 있습니다.
import matplotlib.pyplot as plt

list_x = [1, 2, 3, 4, 5]
list_y_1 = [2, 4, 6, 8, 10]
list_y_2 = [2, 3, 4, 5, 6]

plt.plot(list_x, list_y_1, label='First line')
plt.plot(list_x, list_y_2, label='Second line')
plt.legend()

plt.show()
여러 개의 line chart가 동시에 존재한다고해도 각각의 line chart plot에서 label을 지정해주면 범례 표시가 가능합니다.


